Most support leaders do not suffer from a lack of data. They suffer from too much of it.
Dashboards fill up with average handle time, service level agreement targets, occupancy, abandonment rate, CSAT, NPS, and dozens of other customer support metrics. The result looks disciplined, yet many teams still miss the bigger picture: not every number deserves equal attention, and not every metric improves customer loyalty, cost control, or revenue protection.
Strong customer support reporting starts when metrics are treated as signals of operational health, not trophies on a dashboard. That shift is what separates busy contact centers from support organizations that actually improve the customer experience.
Table of Contents
Why customer support metrics matter for business performance
Customer support metrics are measurable indicators that show how well a support team responds to customers, resolves issues, uses staff time, and protects customer relationships. In practice, they help answer four executive-level questions: Are customers getting help quickly? Are issues getting fixed? Are support costs staying under control? Is the support function helping retention and brand trust?
That matters because support is no longer a back-office function. In ecommerce, one bad delivery issue can trigger a refund, a chargeback, and a negative review. In SaaS, slow issue resolution can increase churn risk before renewal. In healthcare, poor access and delays can create compliance concerns and patient frustration. In hospitality, the speed and quality of service can shape the entire guest experience.
When leaders ask which customer service KPIs matter most, the honest answer is this: the best KPIs are the ones that connect customer outcomes to operational choices.
Activity metrics vs performance metrics in customer support
A useful way to sort contact center metrics is to place them into three layers. This keeps teams from overreacting to easy-to-measure numbers while missing the results customers actually feel.
Customer outcome metrics sit at the top because they show whether support is creating value for the customer and the business. Operational metrics sit in the middle because they explain how the team performs. Activity metrics sit at the bottom because they show volume and workload, but rarely tell the full story on their own.
- Customer outcome metrics: CSAT, NPS, Customer Effort Score, retention impact
- Operational metrics: First Response Resolution, ticket resolution time, average response time, SLA attainment
- Activity metrics
- Queue volume
- Calls handled
- Tickets closed
- Agent hours logged
The trap is obvious once you see it. A team can close more tickets, reduce average handle time, and still create worse customer support performance if customers need to contact support again. More activity does not equal better service.
The customer support metrics every business should track
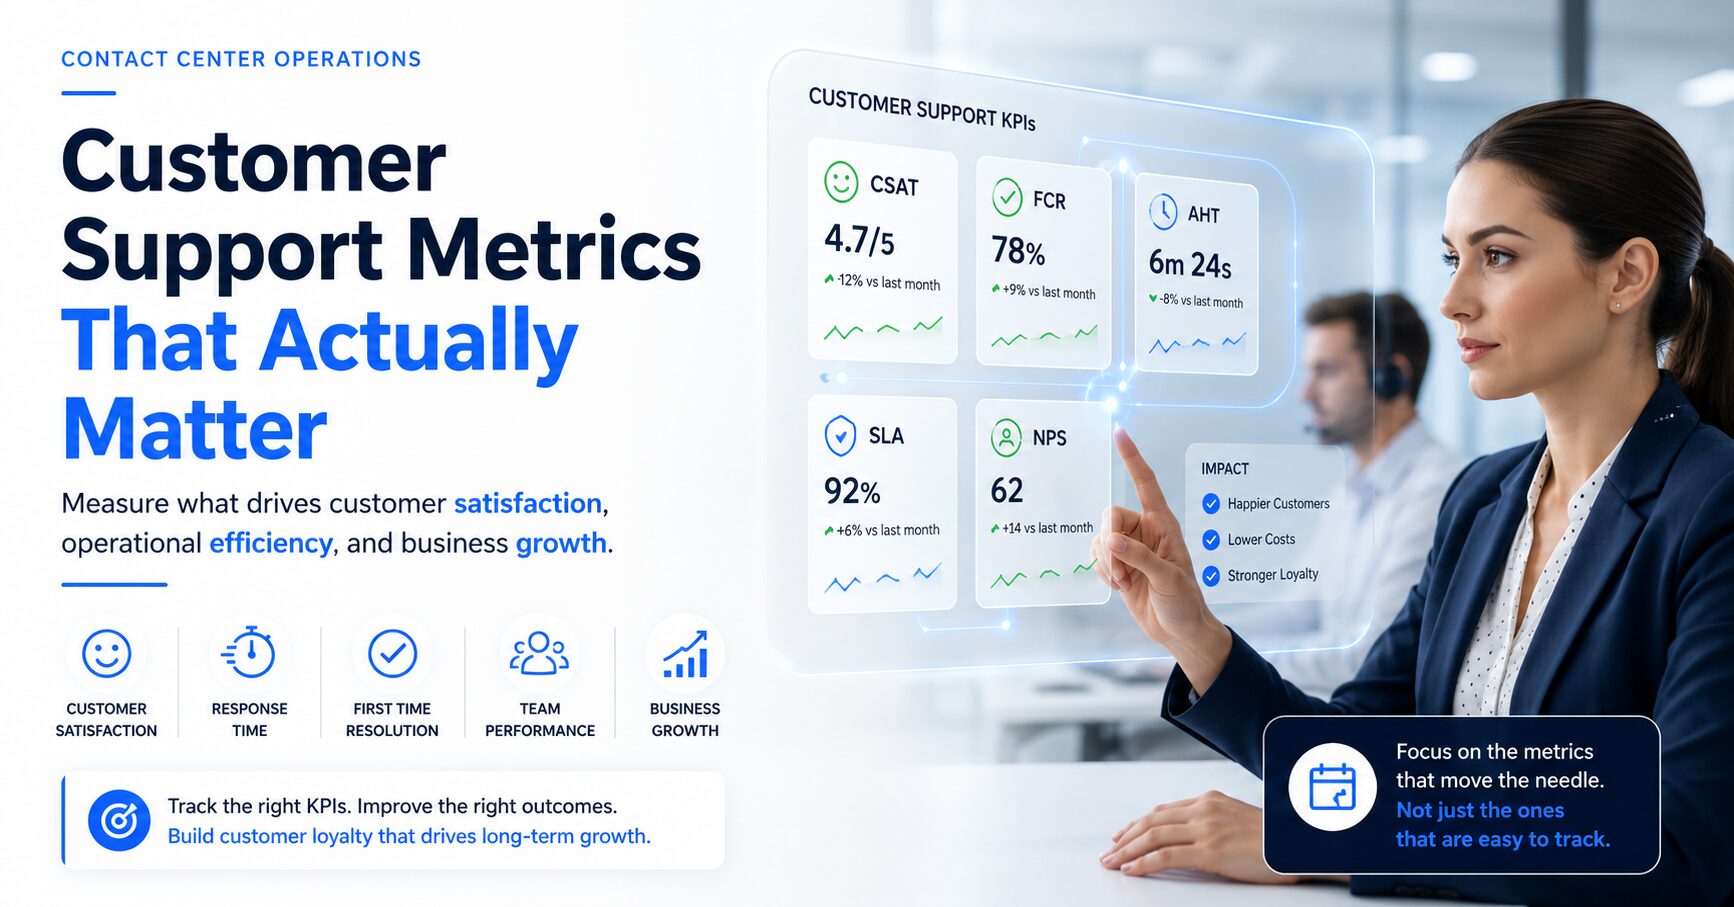
A balanced scorecard for customer support KPIs should include customer outcomes, speed, quality, and workforce efficiency. The table below gives a practical starting point for support directors, CX managers, and BPO decision makers.
| Metric | What It Measures | Why It Matters | Common Mistake |
|---|---|---|---|
| First Response Resolution (FCR) | Whether the issue is resolved in the first interaction | Reduces repeat contacts and builds trust | Treating partial answers as resolution |
| Average Handle Time (AHT) | Time spent per call or interaction | Helps manage staffing and efficiency | Pushing speed at the cost of quality |
| Customer Satisfaction Score (CSAT) | Immediate satisfaction after support | Strong read on transactional service quality | Reading it without response context |
| Net Promoter Score (NPS) | Long-term loyalty and likelihood to recommend | Connects support to brand perception | Using it as a pure support metric |
| Customer Effort Score (CES) | How easy it was to get help | Predicts loyalty and repeat behavior | Ignoring process friction behind the score |
| Service Level Agreement (SLA) | Whether response targets are met | Sets service expectations and accountability | Focusing on target hit rate alone |
| Average Response Time | Time until first reply | Strong early indicator of accessibility | Assuming fast replies mean fast solutions |
| Call Abandonment Rate | Share of callers who leave before reaching support | Reveals queue friction and staffing gaps | Seeing it only as a telephony problem |
| Ticket Resolution Time | Time from ticket open to full close | Shows how long customers wait for closure | Ignoring backlog age and complexity |
| Agent Utilization | How much agent time is spent handling work | Helps capacity planning and labor control | Pushing utilization so high that quality drops |
First Response Resolution (FCR) and customer loyalty
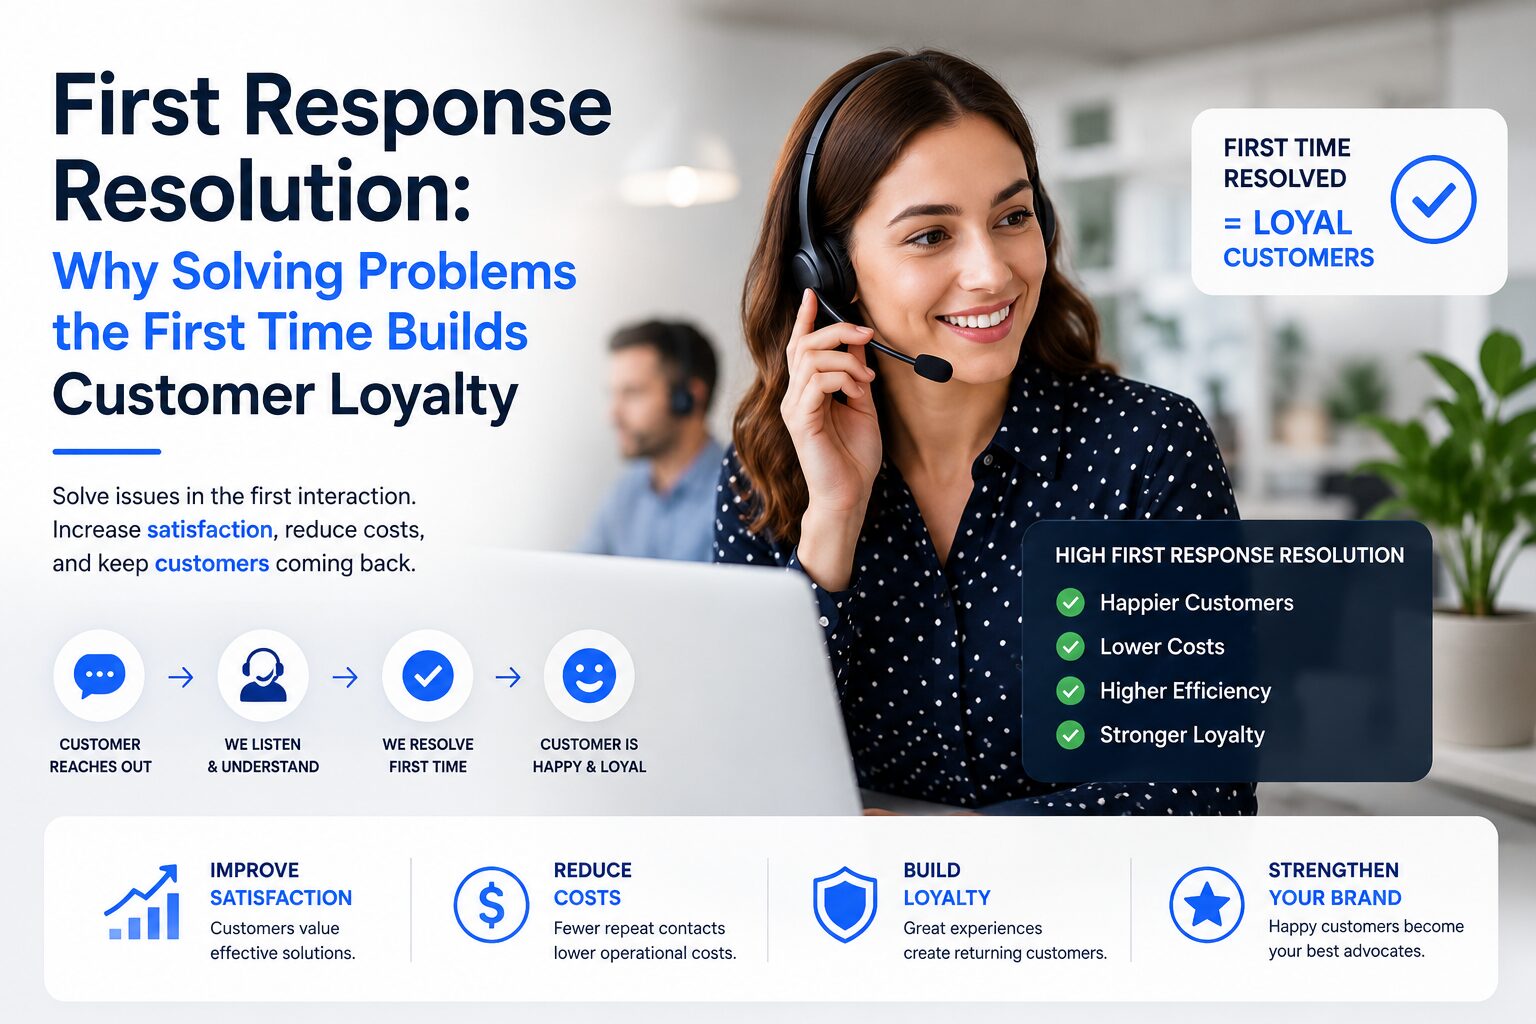
First Response Resolution, often discussed alongside first contact resolution, is one of the clearest signs of support quality. It measures whether a customer gets their issue solved in the initial interaction rather than being passed around, asked to repeat information, or told to wait for another team.
This metric has a direct link to customer satisfaction metrics because customers value closure more than speed alone. In SaaS, a user who gets a billing problem fixed in one chat session is far more likely to stay confident in the product. In healthcare scheduling, one successful call can prevent missed appointments and repeated outreach.
Average Handle Time (AHT) and operational efficiency
Average handle time is one of the most discussed call center metrics because it affects staffing, queue length, and cost per contact. AHT can be useful, especially in high-volume environments like BPO operations or retail support during peak season.
Still, AHT becomes dangerous when treated like the main goal. If agents rush through calls to hit a time target, quality drops and repeat contacts rise. A hotel reservations team may reduce handle time by skipping clarifying questions, only to create booking errors that require a second call later.
Customer Satisfaction Score (CSAT) and service quality
CSAT measures how satisfied customers feel after an interaction, usually through a short survey. It remains one of the most practical customer support KPIs because it reflects the moment customers are most likely to remember clearly.
A strong CSAT score usually points to clear communication, issue ownership, and respectful service. Yet it works best when paired with other metrics. A team may receive high CSAT on simple requests while still struggling with complex cases that take too long to resolve.
Net Promoter Score (NPS) and long-term brand impact
NPS is broader than support, but support often shapes it. By analyzing customer service metrics, executives can better understand how support repeatedly rescues poor product or delivery experiences, leading NPS to fall even when CSAT remains stable. That difference matters for executives who want to connect support operations to revenue and retention.
In ecommerce, a customer may be happy with a refund interaction but still hesitate to recommend the brand if the original issue was painful. NPS helps expose that gap.
Customer Effort Score (CES) and friction reduction
Customer Effort Score asks a simple question: how hard was it to get help? This makes CES one of the most revealing customer satisfaction metrics for modern support operations.
Low-effort support tends to create better loyalty because customers do not want to repeat account details, switch channels, or wait through long transfers. In hospitality, a guest who reaches a real person quickly and resolves a room issue without being bounced around is likely to rate the service far more favorably.
Service Level Agreement (SLA) and expectation management
A service level agreement defines the response or resolution targets a support team commits to. SLA performance is a core part of customer support reporting because it brings discipline to timing and prioritization.
Yet an SLA target is not the same as a good customer experience. Responding within one hour with a generic acknowledgment may satisfy the SLA while doing little to solve the issue. That is why SLA performance should sit beside FCR, CSAT, and ticket resolution time on any dashboard.
Average response time and access to support
Average response time measures how quickly a customer hears back after reaching out. It is often one of the first metrics leadership sees because long delays are visible and easy to explain.
This is also where live answering can change multiple KPIs at once. A well-run Live Reception setup can reduce response time, improve First Response Resolution, and lower call abandonment by connecting customers with a real person instead of a queue or voicemail loop.
Call abandonment rate and demand-pressure signals
Call abandonment rate shows how many callers give up before reaching support. High abandonment is usually a sign of queue pressure, poor staffing forecasts, or phone systems that make access feel difficult.
In healthcare and hospitality, this metric carries extra weight because abandoned calls often represent urgent needs. A patient who hangs up may delay care. A guest who cannot reach the front desk may post publicly before anyone has a chance to help.
Ticket resolution time and backlog health
Ticket resolution time tracks how long it takes to fully solve a case from open to close. Unlike first response time, this metric captures the full customer wait.
In SaaS and technical support, long resolution times, a crucial aspect of customer service metrics, often point to handoff friction, weak escalation paths, or gaps in knowledge management. For operations managers, this is one of the most useful contact center metrics because it shows whether the system can finish the work, not just receive it.
Agent utilization and workforce balance
Agent utilization measures how much of an agent’s available time is spent handling productive work. It is essential for workforce planning and budget control, especially in larger support teams and outsourced environments.
The problem appears when utilization gets pushed too high. Agents lose recovery time, quality slips, and turnover rises. Many well-run customer support outsourcing programs perform well here because they use standardized workflows, QA reviews, and disciplined forecasting instead of simply asking agents to work faster.
Which customer support KPIs drive customer loyalty
If the goal is loyalty, retention, and brand trust, some metrics deserve more weight than others. The leaders are usually FCR, CSAT, CES, and ticket resolution time. These show whether the customer got help, whether the process felt easy, and whether the issue actually ended.
Efficiency metrics still matter. AHT, utilization, and SLA attainment help control cost and staffing pressure. The mistake is letting them outrank customer outcomes.
- Best loyalty indicators: FCR, CSAT, CES, repeat contact rate
- Best efficiency indicators: AHT, utilization, occupancy, cost per contact
- Best health indicators: SLA attainment, response time, resolution time, abandonment rate
A BPO supporting ecommerce brands may accept a slightly higher AHT if it raises FCR and reduces returns-related repeat contacts. A SaaS support team may prioritize longer first interactions if that leads to stronger onboarding retention. The right mix depends on the business model, but the principle stays the same: customer outcome metrics should guide the scorecard.
Common mistakes when measuring customer support performance
Many teams collect too many numbers and too little insight. They report on what is easy to pull from systems instead of what changes customer behavior or business results.
A few mistakes show up repeatedly:
- Treating AHT as the main indicator
- Reading CSAT without segmenting by issue type
- Counting closed tickets without checking reopen rate
- Using SLA compliance as proof of quality
- Ignoring channel differences in customer effort
Another common problem is measuring metrics in isolation. A drop in average response time looks positive until CSAT falls. A rise in utilization looks efficient until attrition climbs. Support leaders need to read patterns, not single data points.
This is where customer support performance becomes an executive topic, not just an operations topic. The best scorecards show how support affects customer retention, revenue protection, and reputation.
Building a balanced customer support dashboard
A practical dashboard should answer three questions quickly: what customers are experiencing, how the operation is performing, and where the pressure is building. That means combining customer outcome metrics, operational metrics, and activity metrics in one view.
Keep it focused. Most teams do not need twenty KPIs on the front page. They need a smaller set with clear ownership, trend lines, and thresholds for action.
- Dashboard core: FCR, CSAT, CES, resolution time, response time
- Workforce layer: utilization, adherence, occupancy, staffing gap
- Demand layer: contact volume, abandonment rate, backlog age, channel mix
Real value appears when leaders review those numbers together. If abandonment rises, response time slips, and CSAT dips in the same week, the problem may be staffing or forecast accuracy. If AHT rises while FCR and CSAT also rise, the business may be seeing healthier support behavior, not a decline.
For customer support directors and CX managers, that is the real purpose of customer support KPIs. They are not there to create bigger dashboards. They are there to help teams make better calls about staffing, process design, training, channel strategy, and service quality. When that happens, support stops being measured as a cost center alone and starts showing up as a driver of loyalty and growth.