Most support leaders have seen this happen.
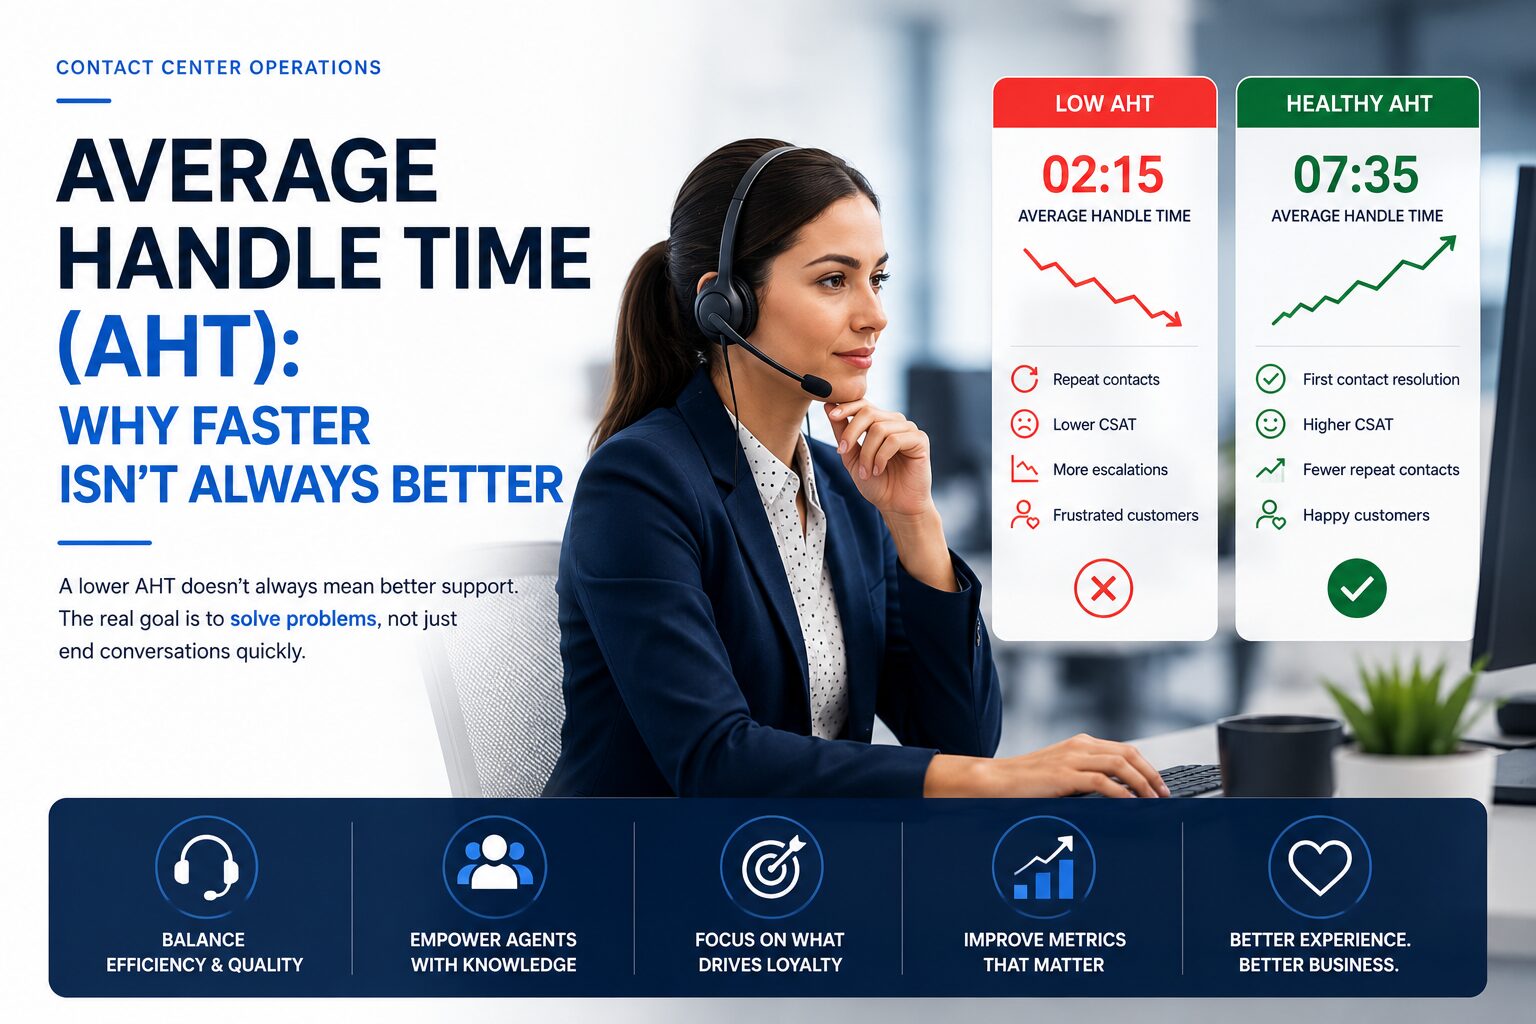
One team celebrates a two-minute call center average handle time. On paper, the operation looks lean, productive, and tightly managed. Yet customers keep calling back because their issue was never fully resolved.
Another team spends seven minutes on the phone, asks better questions, checks the account history, and closes the issue in one interaction. The customer moves on. The team gets fewer repeat contacts. Workload drops over time.
Which team is actually more efficient?
That question gets to the heart of how Average Handle Time should be used. AHT is one of the most useful customer support metrics in any service operation, but it becomes risky when speed turns into the main objective. The strongest support teams do not treat AHT as a finish line. They treat it as one signal inside a broader performance system built around resolution, effort, and customer confidence.
Table of Contents
What average handle time means in customer support
Average Handle Time, often shortened to AHT, measures how long it takes an agent to complete a customer interaction from start to finish. In a phone-based environment, that usually includes the live conversation, any hold time, and the work completed immediately after the call.
As an average handle time KPI, it helps support leaders see how efficiently interactions are being managed. It is widely used in contact centers because it affects staffing, scheduling, queue performance, and cost per contact. It is also one of the easiest numbers to track, which is part of the reason so many organizations give it more weight than it deserves.
AHT matters, but it does not tell the whole story. A short interaction can reflect clarity, great systems, and skilled agents. It can also reflect rushed service, poor diagnosis, or an agent trying to protect a target instead of solving a problem.
That distinction matters because customers do not experience support in averages. They experience it as outcomes.
How average handle time is calculated in a call center
The basic formula is simple:
Average Handle Time = (Talk Time + Hold Time + After-Call Work) / Total Number of Calls
This formula gives leaders a standard way to compare workload across teams, queues, time periods, or providers. It also reveals whether the handling process itself is getting cleaner or more complex.
Each part of the formula has a different operational meaning.
- Talk time
- Hold time
- After-call work
Talk time reflects the live conversation between customer and agent. Hold time shows how often the customer is waiting while the agent searches for information, checks systems, or asks for help. After-call work includes notes, updates, tagging, follow-up tasks, and any documentation required once the customer is off the line.
AHT becomes far more useful when those components are reviewed separately. A rising number might come from stronger documentation standards, not weaker agent performance. A lower number might come from less hold time because systems improved, which is healthy. Or it might come from agents skipping notes, which creates future problems.
Why businesses track the average handle time KPI
Support operations measure AHT because it connects directly to capacity planning. If leaders know how long interactions take on average, they can estimate how many agents are needed for a given volume and how schedules should be built around peaks.
It also helps with cost control. Longer contacts usually increase labor demand, and labor is one of the largest support expenses. When call durations spike unexpectedly, service levels often slip as queues grow and occupancy rises.
Used well, AHT helps answer practical questions about customer service efficiency:
- Staffing: How many agents are needed to meet expected demand?
- Forecasting: What happens to coverage when handle time rises during product launches or outages?
- Scheduling: Which shifts need more experienced agents?
- Process design: Are agents losing time to manual steps, transfers, or fragmented systems?
- Vendor evaluation: Is an outsourced team reducing workload cleanly or simply moving work into callbacks?
These are legitimate reasons to track the metric. No serious contact center should ignore it. The problem starts when AHT stops being a diagnostic metric and becomes the dominant scorecard for customer support performance.
Why reducing average handle time at all costs hurts performance
AHT becomes dangerous when leaders treat speed as proof of quality. That mindset often rewards behavior that looks efficient for a week and creates more work for months.
Take a simple comparison:
| Team | AHT | First Contact Resolution | Repeat Contacts | Likely Customer Experience |
|---|---|---|---|---|
| Team A | 2 minutes | Low | High | Frustrating, incomplete |
| Team B | 7 minutes | High | Low | Resolved, confident |
The lower AHT team appears stronger only if the metric is viewed in isolation. Once repeat contacts are counted, the picture changes. Three short calls are not more efficient than one longer call that solves the issue.
This is the biggest mistake companies make with call center average handle time. They pressure agents to shorten conversations before they improve the systems that make conversations long. Agents respond predictably. They interrupt sooner, transfer faster, avoid probing questions, and close interactions before the customer feels fully helped.
The result often shows up in other customer support KPIs:
- Lower CSAT
- Poorer FCR
- More escalations
- Higher customer effort
- More reopen rates
Low AHT can also hide structural issues. A team may seem fast because the hardest contacts are being routed elsewhere. Or because agents are avoiding ownership. Or because the knowledge base is thin, forcing customers to call back when a partial answer fails.
Support leaders should ask a harder question than “How fast did the call end?” They should ask, “Did the work actually end?”
What is a good average handle time by industry
There is no universal “good” AHT.
A hospitality team answering reservation questions will not look like a healthcare support team dealing with benefits, privacy checks, and care coordination. A SaaS support queue troubleshooting integrations will not resemble an ecommerce queue handling simple order status requests.
That is why rigid benchmarking can mislead decision-makers. AHT must be judged in context: issue complexity, channel mix, compliance requirements, customer expectations, and the maturity of the tools available to agents.
| Industry | Typical AHT Pattern | Why It Varies |
|---|---|---|
| Hospitality | Lower to moderate | Many inquiries are transactional and time-sensitive |
| Healthcare | Higher | Verification, documentation, and sensitive issue handling take time |
| Ecommerce | Lower to moderate | High volume of repetitive questions, mixed with returns and exceptions |
| SaaS | Moderate to high | Troubleshooting, onboarding, and technical diagnosis lengthen contacts |
| Financial Services | Moderate to high | Security checks, regulations, and risk controls add steps |
A better benchmark is not “Are we faster than everyone else?” It is “Are we resolving the right issues with the right amount of effort?”
If AHT is drifting upward while CSAT and FCR improve, the increase may be healthy. If AHT drops while callbacks, transfers, and complaints rise, the operation is likely getting less efficient, not more.
How to balance AHT with other contact center metrics
The healthiest service operations look at AHT as part of a connected system of contact center metrics. That system should measure both efficiency and effectiveness.
When AHT is reviewed alongside other indicators, leaders can separate productive speed from harmful speed. A fast team that solves problems is strong. A fast team that creates repeat demand is expensive.
The most useful balancing metrics include:
- First Contact Resolution (FCR): Did the customer need to come back for the same issue?
- Customer Satisfaction Score (CSAT): How did the customer rate the experience?
- Customer Effort Score (CES): How hard was it for the customer to get help?
- Net Promoter Score (NPS): Is support helping or hurting loyalty over time?
- Service Level Agreement (SLA): Are response commitments being met at scale?
These metrics are stronger together than they are apart. FCR protects against rushed handling. CSAT reflects the customer view. CES keeps the team focused on ease, not internal convenience. SLA ensures that quality does not come at the cost of availability.
For teams building a stronger scorecard, a useful next read is Customer Support Metrics That Actually Matter. Related topics that deserve the same level of scrutiny include First Response Resolution, Customer Satisfaction Score, Service Level Agreements, Workforce Management, and Contact Center Quality Assurance.
How better processes lower AHT without damaging customer experience
The best way to improve AHT is not to tell agents to talk faster. It is to remove friction from the work around them.
That usually starts with training. Agents who know the product, the systems, and the escalation paths can diagnose issues with confidence. They ask sharper questions and spend less time searching for answers. Good coaching also reduces unnecessary transfers, which lowers total handling time while improving the customer experience.
The same applies to knowledge access. If policies, scripts, troubleshooting steps, and account history are scattered across tools, even skilled agents lose time. A clean knowledge base and a well-integrated CRM can reduce hold time and after-call work without cutting corners.
Several process improvements tend to help both customer service efficiency and customer support performance:
- Knowledge base quality: Clear articles, current policies, searchable content
- CRM integrations: Customer history visible in one place
- Workflow design: Fewer handoffs, cleaner escalation logic
- Quality coaching: Review patterns, not just individual calls
- Multilingual support: Faster resolution when customers can explain issues in their preferred language
Live reception can also make a measurable difference. When customers reach a trained human right away, basic routing errors and repeated transfers often drop. That improves both AHT and customer confidence because the interaction begins with context instead of friction. Teams evaluating this model should look closely at Live Reception Services.
Outsourced support can produce the same benefit when the provider is built around process discipline rather than raw speed targets. Dedicated teams, structured QA, regular coaching, and strong documentation practices often reduce average handle time in a healthy way because the work becomes clearer. Businesses considering that option may want to review Customer Support Outsourcing.
This is where an operational partner like Silver Bell Group fits the conversation. The right partner should not promise shorter calls at any cost. It should focus on better workflows, stronger resolution, and a customer experience that reduces future contact demand instead of pushing it downstream.
AHT is one of the most valuable customer support metrics available to service leaders. It helps with planning, staffing, and process review. It can expose waste. It can show where systems are slowing agents down. It can even reveal where support design is out of step with customer needs.
Still, AHT should measure efficiency, not define it. The strongest teams know that the real goal is not to end conversations quickly. It is to end them well.