Strong BDR performance metrics do more than count effort. They show whether sales development is reaching the right accounts, creating qualified conversations, and adding real pipeline value. That matters for internal teams, outsourced teams, and any revenue leader trying to separate busy work from commercial impact.
BDR performance should be measured across three levels: activity, conversion quality, and pipeline contribution. Calls, emails, and outreach volume show execution capacity, while positive replies, qualified meetings, sales accepted opportunities, and pipeline generated indicate whether that activity creates commercial value. No single KPI provides a complete picture of BDR effectiveness.
Table of Contents
Key takeaways on BDR performance metrics
A practical scorecard needs to connect top-of-funnel execution with downstream sales outcomes.
- BDR performance cannot be evaluated through activity volume alone.
- Activity metrics measure execution, while conversion metrics measure effectiveness.
- Qualified meetings and sales accepted opportunities provide stronger indicators of commercial value.
- BDR performance should be evaluated across the entire outbound sales funnel.
- Performance benchmarks vary by industry, ICP, market, channel, and sales process.
- Internal and outsourced BDR teams should be evaluated using consistent quality standards.
What are BDR performance metrics?
BDR performance metrics are the measures used to evaluate how well business development representatives create qualified sales opportunities from outbound prospecting. They help sales leaders assess consistency, message-market fit, prospect targeting, and pipeline contribution.
Not every metric carries the same weight.
Some BDR KPIs are leading indicators. Calls made, emails sent, and accounts touched show whether reps are doing the work. Other sales development metrics sit farther down the funnel. Positive reply rate, meetings held, sales accepted opportunities, and pipeline generated show whether the work is producing commercially useful outcomes.
That distinction matters because BDRs directly control some inputs, influence some middle-funnel outcomes, and only partially affect later-stage revenue. A strong measurement model respects that reality.
The three levels of BDR performance measurement
The clearest way to assess sales development performance is to group metrics into three levels.
| Level | Metrics | Core question | What it tells you |
|---|---|---|---|
| Activity | Calls, emails, accounts contacted, follow-ups | Are BDRs executing consistently? | Capacity and discipline |
| Conversion quality | Positive replies, conversations, qualified meetings, show rate, sales acceptance | Is outreach reaching and engaging the right prospects? | Effectiveness and qualification quality |
| Pipeline contribution | Sales accepted opportunities, pipeline generated, opportunity progression | Is sales development creating commercial value? | Revenue impact potential |
Used together, these levels create a fairer and sharper view of outbound sales KPIs. A rep with strong activity but weak conversion likely needs help with targeting, messaging, or qualification. A rep with solid conversion but weak pipeline may be booking meetings that do not mature into real opportunities.
What are the most important BDR KPIs?
No single metric should stand alone, though some are more informative than others.
| KPI | Definition | What It Measures | Why It Matters |
|---|---|---|---|
| Outreach volume | Total calls, emails, and touches sent | Execution output | Shows work rate and capacity |
| Account coverage | Number of target accounts contacted | Market penetration | Reveals whether ICP coverage is broad enough |
| Positive reply rate | Positive replies divided by outreach delivered | Message relevance | Indicates early buying interest |
| Conversation rate | Live conversations divided by contact attempts | Connect effectiveness | Shows whether reps reach actual decision-makers |
| Qualified meetings booked | Meetings that meet agreed qualification criteria | Early sales value | Better than counting all meetings |
| Meeting show rate | Meetings attended divided by meetings booked | Meeting quality and prospect intent | Filters out weak bookings |
| Sales acceptance rate | Meetings or opportunities accepted by sales divided by total passed | Qualification quality | Strong signal of credibility |
| Pipeline generated | Opportunity value sourced by BDR efforts | Commercial contribution | Links BDR work to revenue potential |
| Cost per qualified meeting | Total BDR cost divided by qualified meetings | Efficiency | Useful for budget and channel comparison |
| Cost per sales accepted opportunity | Total BDR cost divided by accepted opportunities | Commercial efficiency | Better than cost per meeting alone |
When leaders compare BDR productivity, they should read these metrics in combination. High outreach with weak acceptance is a warning sign. Lower activity with stronger acceptance and pipeline may reflect better account selection or sharper messaging.
Why outreach volume alone is a misleading BDR KPI
Activity is necessary. It is not sufficient.
Consider a hypothetical comparison. Team A sends 12,000 touches in a month and books 30 meetings, but only 8 are attended and 3 are accepted by sales. Team B sends 7,000 touches, books 22 meetings, 18 are attended, and 10 are accepted by sales.
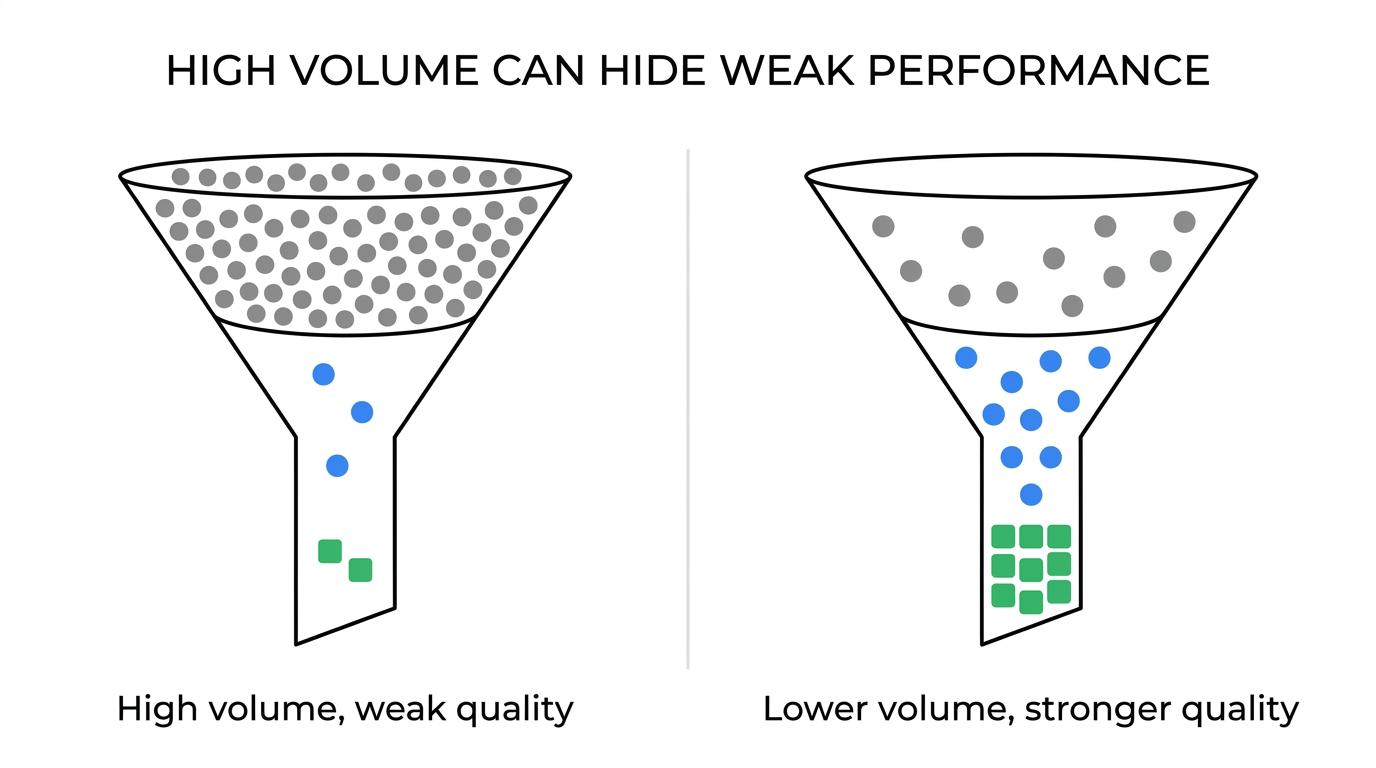
Team A looks stronger if the dashboard stops at volume. Team B looks stronger when quality enters the picture. That does not mean low activity is better. It means outreach volume without conversion context can point leaders in the wrong direction.
This is why many sales development metrics need to be paired. Volume plus reply rate. Meetings plus show rate. Booked meetings plus sales acceptance. Pipeline plus cost.
How do you calculate BDR conversion rates?
Clean formulas matter because small definition changes can distort reporting across reps, campaigns, and time periods. If one team counts auto-replies in reply rate and another excludes them, the comparison is already broken.
Here are simple formulas:
- Positive reply rate: positive replies / delivered outreach
- Conversation rate: live conversations / call attempts or connection attempts
- Meeting booking rate: meetings booked / positive conversations
- Meeting show rate: meetings attended / meetings booked
- Sales acceptance rate: sales accepted opportunities / meetings held or opportunities passed
- Opportunity conversion rate: created opportunities / qualified meetings held
A hypothetical example makes this easier. Assume a BDR sends 1,000 delivered touches, receives 40 positive replies, holds 25 live conversations, books 12 qualified meetings, 9 of those show, and sales accepts 5 opportunities.
The resulting SDR performance metrics would be:
- Positive reply rate = 40 / 1,000 = 4%
- Meeting show rate = 9 / 12 = 75%
- Sales acceptance rate = 5 / 9 if measured from attended meetings, or 5 / 12 if measured from booked meetings
Both methods can be valid, but the company must pick one standard and stick to it.
BDR activity metrics vs pipeline metrics
Activity reporting and pipeline reporting serve different management needs. Activity metrics help frontline managers spot execution problems fast. If follow-ups collapse or account coverage shrinks, coaching can happen this week, not next quarter.
Pipeline metrics help sales leaders judge whether the outbound engine is producing opportunities that matter. That includes sales accepted opportunities, pipeline value, and movement into later stages.
A BDR should not be measured only on closed revenue. Account Executives, deal complexity, pricing, timing, and sales cycle length all shape the final result. BDRs should still be linked to sales pipeline metrics, just not held solely responsible for end-stage outcomes they do not fully control.
Real-world example of BDR outreach capacity
A first-party example from Silver Bell Group helps clarify the difference between execution capacity and business impact. In one program, three dedicated BDRs ran industry-focused outreach across Health, Manufacturing, and IT and achieved a threefold increase in outreach volume.
That result demonstrates operating discipline, resource coordination, and the ability to scale outbound activity. It does not independently prove stronger BDR conversion rate performance, better meeting quality, more pipeline, higher revenue, or improved ROI.
That distinction is essential. If you are trying to scale B2B sales outreach without sacrificing quality, activity growth is only the first checkpoint. The next question is whether conversion quality and pipeline contribution also improve.
How to build a BDR performance dashboard
A useful dashboard should support both weekly coaching and monthly leadership review. Weekly views should lean toward execution and conversion. Monthly views should lean toward qualification quality, pipeline creation, and cost efficiency.
Organize reporting by rep, campaign, industry, ICP segment, outreach channel, and funnel stage. That structure helps managers isolate where performance changes begin.
| Reporting view | Best KPIs | Primary user |
|---|---|---|
| Individual BDR | Outreach volume, conversation rate, meetings booked, show rate | Frontline manager |
| Campaign | Positive replies, qualified meetings, acceptance rate | Sales development leader |
| Industry or ICP segment | Account coverage, reply rate, pipeline generated | RevOps and leadership |
| Channel | Email response, call connect rate, meeting booking rate | Sales development manager |
| Commercial efficiency | Cost per qualified meeting, cost per accepted opportunity | CRO, CEO, finance |
If the team is comparing internal and outsourced models, use the same quality standards across both. That is where a piece like In-House vs Outsourced Sales Development: Which Is Better? becomes useful: the operating model matters less than the consistency of measurement.
What are good BDR performance benchmarks?
Universal benchmarks often mislead more than they help. A BDR selling enterprise software into tightly defined accounts should not be compared with a rep targeting mid-market buyers in a broader category. Deal size, ICP precision, channel mix, brand recognition, and qualification rules all affect results.
A better approach is to build historical baselines inside your own operation. Compare by segment, by campaign type, and by market. Then review trend lines rather than isolated months.
External benchmarks can still help, but only when the source is credible, dated, and methodologically clear. Without that context, benchmark numbers create false certainty.
How should you evaluate an outsourced BDR team?
Outsourced teams should be measured with the same discipline used for internal BDRs. The core questions do not change: Are they targeting the right prospects? Is outreach consistent? Are meetings qualified? Is sales accepting what they pass? Is pipeline being created at a sensible cost?
That means looking beyond booked meetings alone. Reporting transparency, qualification standards, and collaboration with internal sales teams all matter. Commercial efficiency matters too, especially if leadership is comparing build-versus-buy options or reviewing how much sales development outsourcing costs.
When evaluating a managed provider, a structured service model helps. This is the right place to review actual sales outsourcing services and assess whether the provider can report on activity, quality, and pipeline with equal clarity.
Common BDR performance measurement mistakes
Most reporting issues come from weak definitions, narrow scorecards, or missing funnel visibility.
- Measuring only calls and emails: add reply rate, show rate, acceptance, and pipeline data
- Treating every booked meeting as equal: separate qualified meetings from unqualified bookings
- Ignoring meeting attendance: track show rate to filter low-intent prospects
- Failing to track sales acceptance: require feedback loops from AEs or sales managers
- Comparing unlike segments: review by industry, ICP, and channel before comparing reps
- Using inconsistent qualification rules: define accepted meeting and accepted opportunity clearly
- Focusing on short reporting windows: review in relation to actual sales cycle length
How to build a BDR performance framework that drives revenue
Start with the ICP and qualification criteria. If those are vague, every downstream metric becomes noisy. Next, choose a balanced set of BDR activity metrics, conversion indicators, and pipeline KPIs. Then make sure reporting definitions are stable across teams and time periods.
The best scorecards are simple enough to coach from and rigorous enough to trust. They reward execution, but they place greater weight on commercially relevant outcomes: qualified meetings, sales acceptance, and pipeline created.
FAQ on BDR performance metrics
What are the most important BDR performance metrics?
The most useful BDR performance metrics span three levels: outreach activity, conversion quality, and pipeline contribution. Qualified meetings, meeting show rate, sales acceptance rate, and pipeline generated usually provide a stronger view of value than raw activity alone.
How do you measure BDR productivity?
Measure BDR productivity by combining output and outcome. Outreach volume, account coverage, and follow-up consistency show work rate. Qualified meetings, acceptance rate, and cost per accepted opportunity show whether that work is productive.
What is a good BDR conversion rate?
A good BDR conversion rate depends on industry, ICP, deal size, outreach channel, and qualification standards. The better question is whether conversion rates are improving against your own historical baseline and whether they lead to accepted opportunities.
How many meetings should a BDR book?
There is no universal target that applies across teams. Meeting expectations should reflect market difficulty, account quality, outreach mix, and qualification rigor. More meetings are only better when show rate and sales acceptance stay healthy.
What is the difference between BDR activity metrics and pipeline metrics?
BDR activity metrics measure execution, including calls, emails, touches, and follow-ups. Pipeline metrics measure commercial outcomes, including accepted opportunities and pipeline value. One shows effort. The other shows business impact potential.
How do you measure outsourced BDR performance?
Use the same framework you would use for an internal team: activity consistency, targeting accuracy, meeting quality, sales acceptance, pipeline contribution, and cost efficiency. Outsourced BDR performance should not be judged by meeting count alone.
Should BDRs be measured by revenue generated?
Not exclusively. Revenue is influenced by many factors outside the BDR role, including AE performance and sales cycle length. BDRs should be tied to pipeline creation and opportunity quality more directly than closed revenue alone.